 |
| Zipf |
When researchers analyze data sometimes remarkable patterns are found. One of these patterns is Zipf's Law, named after linguist George Kingsley Zipf (1902-1950). He found that the frequency of any word is inversely proportional to its rank in the frequency table. Specifically, he found that the most frequent word, will occur approximately twice as often as the second most frequent word, three times as often as the third most frequent word, etc.
Thus he found that the most occuring word 'the' accounts for 7 percent of all word occurences (69.971 out of 1 million), the second most occuring word 'of' account for 3.5 percent of all word occurences etc.
However, Zipf's law also seems to hold for the distribution of city sizes all over the world, especially when 'small' cities are excluded. What is considered 'small' differs trough time and country and is up for debate. Thus when Zipf's law holds, the largest city in a country is two times as big as the second largest city in the country, three times as big as the third largest city in the country, etc. This can be shown by plotting the natural logarithm (ln) of the rank and of city size (number of people) in a diagram. If the slope of the line equals minus 1, zipf's law holds for this country. In other words we are gone estimate the function: \[ ln(\mbox{ city size}_i) = \alpha + \beta\, ln(\mbox{rank}) \]
This can be very easily done, with for example excel. I will give a quick how-to below.
An example file can be found here.
To get started we obviously need our data first. A good source is http://www.citypopulation.de/, you could also try your national statistics bureau. For this example I will choose the Netherlands (under countries, europe and then the Netherlands) and choose to use the data of 'major urban areas': urban areas with more than 15.000 inhabitants. Of course you can also choose one of the other options with a lower or higher population threshold, and observe the differences. But as said before, including (relative to your country) very small cities is not recommended. Citypopulation.de lets you already sort your data by population, otherwise this can be done using the filter option in excel (in the right click menu or under the data tab). To import the data into excel just save the webpage by right clicking and choosing the save option. You can then just open the webpage into excel. When using internet explorer you can also choose the export to excel function when right clicking the webpage.
step 2: transform the data
Copy the appropriate data to a new worksheet and sort the cities on size, if not already done so and give each city the appropriate rank, i.e. the largest city has rank 1, the second largest city has rank 2 etc. Now all that is left to do is to take the natural logarithm of both the rank and city size variables. This is done by using the formula =ln(cell). So if you did everything oke you know have two collums with ln(city size) and ln (rank), see the example file.
step 3: making the graph (note that sadly the trendline doesn't show up in google docs).
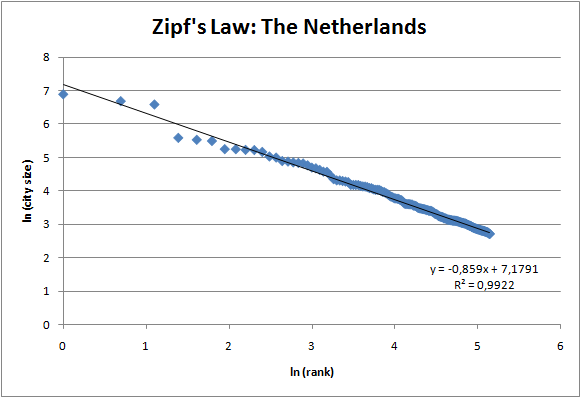
select your data and choose the scatter plot graph in excel. Make sure ln (rank) is used for the X-axis and ln(city size) is used as the Y-axis. Hopefully you now have a graph with data point that lie approximately on a straight line.
To calculate our slope right click on the graph and choose add trendline. Make sure it is set to linear, and the box add eqution and R-squared is checked. If the slope is close to minus 1 the distribution of cities in your country follows zipf’s law. For the Netherlands, the slope is -0.859 and thus does not perfectly follow zipf’s law. However, our R-squared is extremely high, which means that our (regression)line does fit the data well and explains most of the variance. Indeed, following this formula we expect the 15th city to have a population of around 128.000, in our data set the 15th city (Breda) has a population of around 131.000, pretty close!
Note: that when adding the trendline you actually performed a simple (least squared) regression in excel. Excel can also calculate this slope without first making the graph. Use the formula slope(y,x) to get the same result. (for the intercept you can use the formula intercept(y,x), for R-squared you can use the formula rsq(y,x)).
Recent research have shown that for most countries the slope is not exactly -1 and therefore the strict version of zipf’s law does not hold.
For more information about the distribution of cities and Zipf’s law you can look for example at: http://www.oup.com/uk/orc/bin/9780199280988/01student/zipf/
If you have any problems or questions do not hesitate to comment!

Thank you so so much. It was very very helpful and I had been searching for this exact information.
ReplyDeleteI hope your blog gets lots of traffic.
Really saved a lot of my time.
One problem though, the example file is not opening.
ReplyDeleteThanks a lot nevertheless.